Restaurant simulator model guide
Small Pizza Restaurant Simulator Strategy Guide
The safest Small Pizza Restaurant strategy is to protect contribution before chasing delivery volume. Establish one full month with a focused menu, Balanced pricing, Standard Ingredients, the starting staff, and no promotion. Then test one demand or capacity lever while watching completed orders, platform fees, kitchen pressure, satisfaction, cash, and monthly profit.
Jump directly into a structured baseline challenge
Launch Restaurant Profit Simulator with deck pizza ovens, delivery drivers, and dough prep batching.
Understand the pizza restaurant starting model
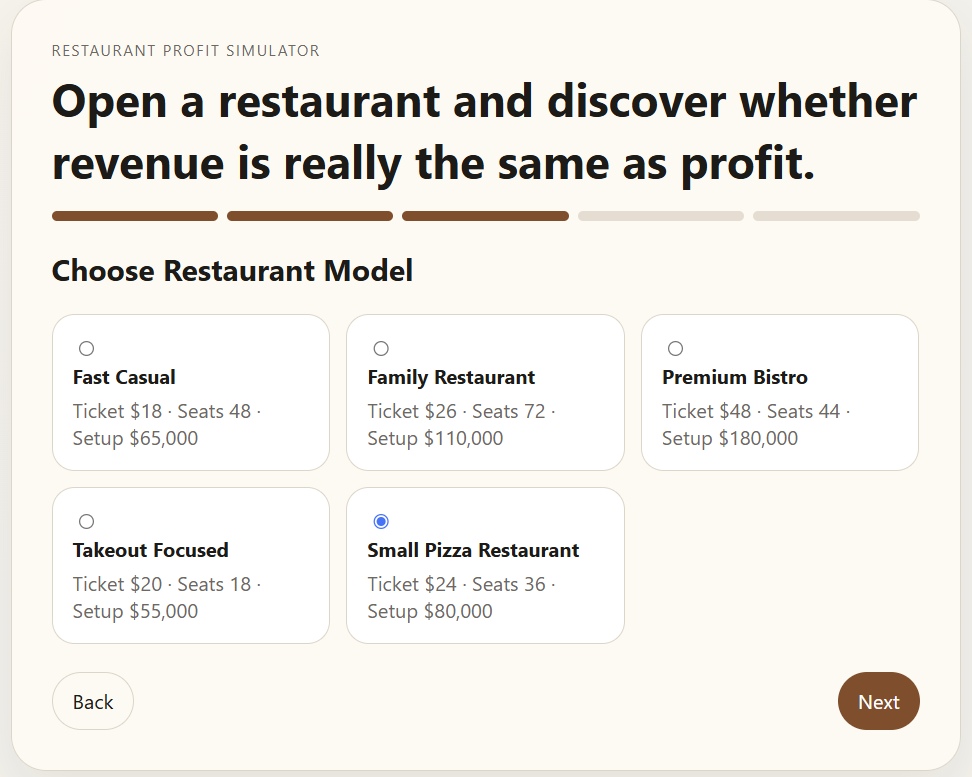
The simulator gives Small Pizza Restaurant an $80,000 setup cost, a $24 base ticket, 36 seats, three chefs, three servers, one cleaner, and one manager. Its modeled food-cost rate is 28%, table-turnover factor is 2.35, and starting delivery tendency is 42%. These are simplified game assumptions, not forecasts for a real restaurant.
This starting position sits between the low-overhead Takeout Focused model and larger dine-in concepts. Pizza has a favorable modeled food-cost rate, but delivery is not free margin. The simulator charges a 25% platform fee on delivery sales. Delivery can reach customers beyond the dining room, yet it shares kitchen capacity with dine-in demand and may produce less contribution per order.
| Starting feature | Model value | Decision implication |
|---|---|---|
| Setup and ticket | $80,000 and $24 | Moderate fixed commitment; protect ticket contribution before adding demand cost. |
| Dining capacity | 36 seats; 2.35 turnover factor | A small room can constrain dine-in demand, but empty seats do not justify extra promotion. |
| Starting labor | 3 chefs, 3 servers, 1 cleaner, 1 manager | Identify whether the kitchen or service system is limiting orders before hiring. |
| Food cost | 28% modeled base rate | Ingredient quality and menu choices can change cost and satisfaction. |
| Delivery | 42% tendency; 25% platform fee | Delivery can expand reach but may trade margin for volume and kitchen load. |
Calculate contribution before choosing a channel
Start with contribution, not revenue. A rough dine-in contribution per order is the selling price minus food and other variable order costs. A rough delivery contribution also subtracts packaging and the platform fee. Neither figure is monthly profit because contribution still must cover payroll, rent, marketing, maintenance, and other period costs.
Dine-in contribution per order = ticket − food and other per-order costs
Delivery contribution per order = ticket − food cost − packaging − platform fee − other per-order costs
Break-even added orders = added monthly fixed cost ÷ contribution per added order
For a simple illustration using only the simulator’s $24 base ticket and 28% modeled food-cost rate, food cost is about $6.72 and contribution before other variable costs is about $17.28 for a dine-in order. A 25% delivery platform fee is $6 on a $24 order, leaving about $11.28 before packaging and other variable costs. This is an instructional estimate, not the simulator’s entire calculation or a promise of a real margin.
If a $1,800 Delivery App Promotion produced 120 truly incremental delivery orders at an estimated $10 contribution each, the added contribution would be $1,200—less than the campaign cost. At 220 incremental orders, the same estimate would produce $2,200 before capacity side effects. The difference matters only if the orders were genuinely added, not shifted from dine-in, and the kitchen completed them without harming satisfaction.
Build a baseline that can answer a question
- Choose a compatible location. Residential Street supports dinner, weekend, and delivery demand; University Area offers lower modeled rent and strong delivery. Higher-traffic sites can work, but the extra rent must earn its keep.
- Keep the opening menu focused. Start with a defensible set of pizzas and a small number of sides or add-ons. A larger menu is not automatically more attractive if it raises complexity or weakens execution.
- Use neutral operating choices. Balanced pricing and Standard Ingredients create a clearer reference point than stacking a discount, premium inputs, major advertising, and extra staff immediately.
- Run a complete month. Record traffic, dine-in and delivery orders, lost customers, kitchen pressure, seat utilization, satisfaction, reputation, revenue, platform fees, food cost, payroll, profit, and cash.
- Name one constraint. Decide whether the evidence suggests insufficient demand, kitchen capacity, service capacity, weak contribution, or an unstable customer experience.
Daily results can vary because of events and demand patterns. Use the monthly report for the main comparison, note unusual events, and repeat a promising result before treating it as a dependable strategy.
Run a controlled delivery-capacity experiment
A useful pizza-model question is: Does a delivery promotion add profitable demand, or overload the kitchen with lower-contribution orders? Keep the city, location, concept, menu, price, ingredients, staff, comparison length, and all other marketing choices constant.
| Stage | Decision | Evidence to retain |
|---|---|---|
| Baseline | No delivery promotion for one full month. | Delivery orders, dine-in orders, kitchen pressure, lost customers, fees, profit, satisfaction, and cash. |
| Test | Change only to Delivery Free Fee Campaign or Delivery App Promotion. | The same measures over the same length, plus the promotion’s direct cost. |
| Calculation | Estimate incremental delivery contribution after food, platform, packaging, and campaign costs. | Show units and distinguish incremental orders from total orders. |
| Guardrail | Precommit a reversal rule. | For example: reverse if profit falls, cash becomes unsafe, or pressure and lost customers rise without adequate contribution. |
| Repeat | Run the stronger choice again under matched settings. | Check whether the direction persists despite ordinary variation or events. |
If the baseline already shows heavy kitchen pressure, test capacity before promotion. Adding demand to a known bottleneck is not a clean test of the channel; it mainly demonstrates that the current system cannot process more orders.
Diagnose six common result patterns
| Observed pattern | Likely interpretation | Next controlled test |
|---|---|---|
| Delivery orders and revenue rise, but profit falls. | Platform fees, discounting, campaign cost, or congestion may exceed added contribution. | Remove the promotion or compare a smaller campaign while holding capacity constant. |
| Kitchen pressure and lost customers rise together. | The kitchen may be the current constraint; more demand can worsen the loss. | Test one chef or a simpler menu without changing promotion. |
| Seats are underused and kitchen pressure is low. | The model may have a demand or conversion problem rather than a capacity problem. | Test one price, promotion, or location-fit lever. |
| Profit rises while satisfaction and reputation fall. | The short-term gain may weaken repeat demand or indicate a value or service problem. | Restore the guardrail and test quality, staffing, or a smaller price move. |
| A chef raises capacity but profit does not improve. | The restaurant may lack enough profitable demand to cover added payroll. | Reverse the hire, or test demand only after confirming spare profitable capacity. |
| One month looks excellent and the repeat does not. | An event, timing, or normal variation may explain the first result. | Run another matched period and make a bounded recommendation. |
Use price, quality, menu, and staffing in sequence
Price: Low Price increases modeled conversion but reduces the ticket; Premium Pricing raises the ticket but reduces conversion. Test price after service is stable. Compare contribution and total profit, not only order count or average ticket.
Ingredient quality: Cheap Ingredients reduce modeled food cost but harm satisfaction, while Premium Ingredients raise cost and satisfaction. Treat quality as a value decision with both a financial outcome and a customer guardrail.
Menu: More items can broaden appeal but may increase complexity. Remove persistently weak items only after reviewing popularity and margin over enough time. Do not confuse one unusual day with a durable product pattern.
Staffing: Hire for an identified role constraint. A chef should be tested against kitchen pressure and completed orders; a server should be tested against service capacity and customer loss. Compare added contribution with the full payroll effect and keep a cash stop rule.
Promotion: Marketing buys simulated reach, not guaranteed profit. Fix weak unit economics and capacity first. Then test one campaign, calculate its incremental result, and stop if it attracts orders the system cannot serve profitably.
Teach a 50-minute pizza channel investigation
- Minutes 0–7: define ticket, variable cost, contribution, platform fee, fixed cost, capacity, and guardrail.
- Minutes 7–15: teams use the same pizza setup and record a complete baseline month.
- Minutes 15–20: each team names one constraint and precommits one delivery or capacity change, one intended outcome, one financial measure, and one customer guardrail.
- Minutes 20–32: teams run the matched test and capture the same report fields.
- Minutes 32–41: calculate channel contribution, break-even added orders, profit margin, or percent change. Note one unusual event or model limitation.
- Minutes 41–50: teams recommend keep, revise, reverse, or repeat. Each student proposes one next controlled test.
Short routes: for 15 minutes, provide two completed reports and ask students to identify the stronger channel after fees and guardrails. For 30 minutes, provide the baseline and let teams design one test. With shared devices, rotate operator, recorder, calculation checker, constraint monitor, and skeptic roles.
Assess whether students preserve a fair comparison, calculate with correct units, connect at least three measures, distinguish revenue from profit, state uncertainty, and respect the stop rule. The printable Restaurant Simulator worksheet supplies an evidence table, teacher prompts, answer guidance, and a 12-point rubric.
Keep the lesson legal, safe, and honest
Restaurant Profit Simulator is a simplified educational model, not a business plan, earnings forecast, valuation, or substitute for local evidence. Real pizza businesses face food-safety and allergen controls, permits, inspections, employment and scheduling law, accessibility duties, taxes, leases, insurance, worker safety, equipment standards, waste handling, delivery-platform contracts, competition, and changing customer behavior.
Do not turn a classroom activity into real purchases, calls, reviews, employee observation, personal-data collection, or public advertising. Claims about price, ingredients, availability, delivery time, quality, or outcomes must be truthful and supportable. A simulated profit result never justifies weakening safety, lawful staffing, privacy, accessibility, or honest communication.
The simulator is free and requires no student account. Use fictional team names and simulated records. Real investment, pricing, employment, tax, food-safety, licensing, advertising, or legal decisions require current local research and qualified guidance where appropriate.
Small Pizza Restaurant Simulator FAQ
What is a good beginner setup for the Small Pizza Restaurant model?
Use a moderate-cost city, Residential Street or University Area, Balanced pricing, Standard Ingredients, no promotion, Local Flyers, and the starting staff. Run a complete baseline month before changing one decision.
Is delivery always profitable for the Small Pizza Restaurant?
No. Delivery can add demand, but the simulator applies a 25% platform fee and delivery orders also use kitchen capacity. Compare delivery contribution, platform fees, kitchen pressure, lost customers, and total profit.
When should I add a chef or server?
Add the role tied to a measured constraint. Persistent kitchen pressure supports testing a chef; service pressure with spare kitchen capacity may support testing a server. Keep the hire only if added contribution exceeds payroll without weakening cash.
Why can pizza restaurant revenue rise while profit falls?
Discounts, delivery platform fees, premium ingredients, added payroll, marketing, rent, or menu complexity can absorb the extra revenue. Read the monthly profit bridge and cost shares instead of treating sales as profit.
Can this Small Pizza Restaurant guide be used in class?
Yes. Students can run a baseline and one matched delivery or capacity test, calculate dine-in and delivery contribution, diagnose a constraint, state one model limitation, and recommend the next test in about 50 minutes.