Unit economics and safe shift decisions
Ride-Hailing Driver Simulator strategy guide
A strong simulated shift does not chase the largest gross fare. It compares the money left after fees and fuel with the time, distance, fatigue, rating risk, and next-best use of the shift.
Jump directly into a structured baseline challenge
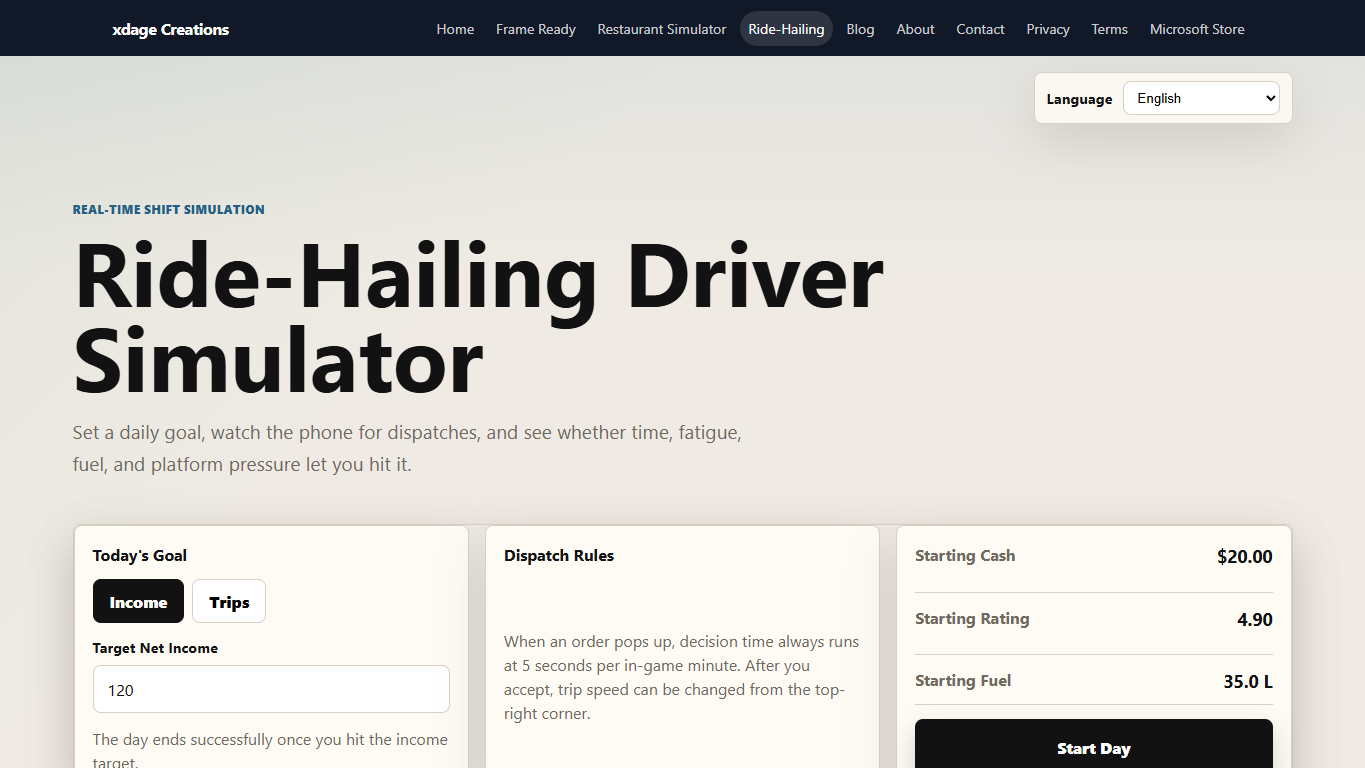
Launch Ride-Hailing Driver Simulator with morning airport trips, fuel economy constraints, and shift fatigue limits.
The short answer: how to build a stronger shift
Begin with the default income goal and treat the first run as a baseline. Favor trips with a manageable pickup, positive estimated net value, and reasonable total time. Keep enough fuel to preserve choices, and rest before fatigue becomes high. After the shift, compare net earnings per hour, completed trips, acceptance rate, distance, fuel, rating, and fatigue. A busy shift is not automatically a productive one.
On the next run, change one decision rule: for example, reject pickups above a chosen distance, require a minimum estimated net amount, or rest at a lower fatigue threshold. Keep the goal and other rules stable. The stronger rule is the one that improves the selected result without shifting unacceptable cost or safety risk elsewhere.
Separate gross fares from net earnings per hour
Trip net contribution = gross fare − platform fee − trip fuel and other modeled variable costs. A positive contribution means the trip adds money before broader vehicle and personal costs that the simplified model may omit. Net earnings per hour = shift net earnings ÷ hours worked. For example, $96 in gross fares minus $18 in fees and $14 in modeled fuel leaves $64. Over an eight-hour shift, that is $8 per hour before omitted taxes, insurance, maintenance, depreciation, financing, cleaning, licensing, and unpaid administrative time.
Use the displayed estimate as a decision aid, not a guarantee. A $24 trip with a long unpaid pickup and a long duration can produce a weaker hourly return than two shorter, nearby trips. The free unit-economics and margin calculators can help check the arithmetic, but a calculator cannot decide whether the underlying assumptions are realistic.
Read every dispatch as a complete cost-and-time package
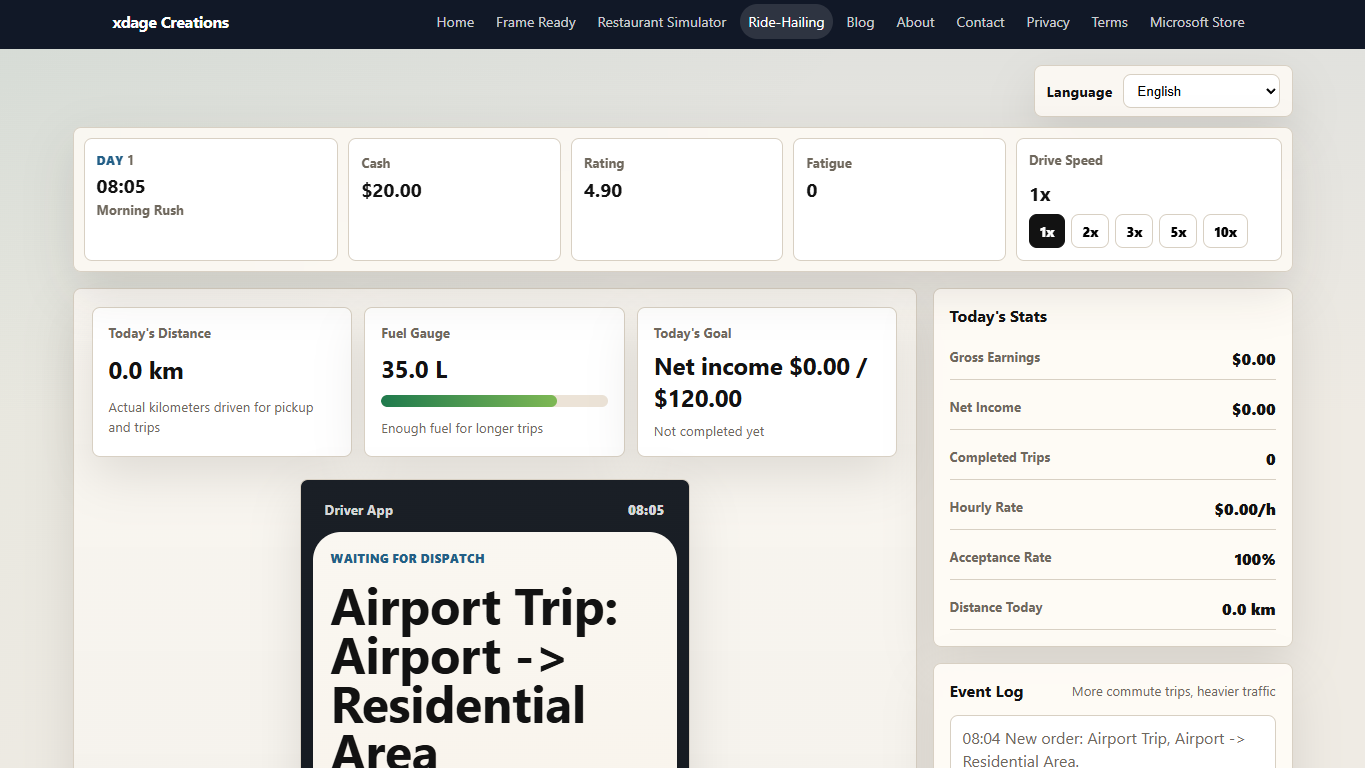
Compare pickup distance, trip distance, estimated time, gross fare, estimated net value, surge, and risk tags before accepting. Pickup travel matters because it uses time and fuel without carrying the rider. Duration matters because an accepted trip blocks every alternative during that period. Surge can raise the fare, but urgency, traffic, or rider expectations can also increase risk.
- Short trips: useful when pickup time is low and turnover is quick; weak when minimum fees and unpaid distance absorb the fare.
- Standard trips: a practical baseline because time, distance, and net value are easier to compare across runs.
- Long or airport trips: potentially valuable, but only with enough fuel, time, and fatigue capacity and a clearly stronger net return.
- Surge trips: test selectively; a higher gross fare does not erase congestion, risk, or a long repositioning cost.
Run a five-step controlled trip experiment
- Baseline: complete one income-goal shift using a consistent, moderate acceptance rule.
- Question: choose one uncertainty, such as whether long pickups reduce net earnings per hour.
- Rule: set one measurable change, such as rejecting pickups above a chosen distance.
- Repeat: use the same goal and keep rest, refuel, and other selection rules as consistent as the random offers allow.
- Evaluate: compare net earnings per hour plus at least two supporting measures, then keep, reverse, or refine the rule.
Dispatches and events vary, so one pair of shifts is evidence, not proof. Repeat the most promising rule. Record the offer mix and major events in the printable ride-hailing worksheet so a lucky surge or unusual delay is not mistaken for a reliable strategy.
Diagnose the result before changing the rule
| Evidence pattern | Likely issue | Next controlled test |
|---|---|---|
| High gross fares but weak net earnings per hour | Fees, fuel, long pickups, or long trip time absorb value | Require a stronger estimated net value or shorter pickup while holding the goal steady. |
| Many trips but the income goal is missed | Volume is replacing trip quality | Raise the minimum net threshold and compare fewer, stronger trips. |
| Low acceptance and long idle time | The selection rule may be too strict | Relax one threshold slightly, especially during slower time periods. |
| Rating falls as the shift continues | Fatigue or risky trip conditions are degrading service | Rest earlier and avoid combining high fatigue with flagged trips. |
| Strong early earnings followed by forced rejections | Fuel planning removed later choices | Use an earlier refuel trigger and compare the full shift result. |
| Goal is reached with very high fatigue | The financial result shifted cost to safety | Use a lower rest threshold; treat safety as a constraint, not a score tradeoff. |
Protect fuel, fatigue, and rating as operating capacity
Fuel is a choice reserve. Waiting until the tank is nearly empty can make otherwise useful trips impossible and can force a badly timed stop. Test a refuel trigger that preserves enough fuel for the plausible next trip. Refueling still costs money and time, so compare the full-shift result rather than treating a full tank as automatically better.
Fatigue is a safety constraint, not merely another expense. Resting uses time, but delaying rest can increase service and rating risk and models an unsafe decision pattern. Rating reflects service consistency and can affect future opportunities in the simulation. Protecting it is a long-run decision, but no rating or earnings target justifies driving while unsafe or violating a real legal limit.
Adapt to the time period without chasing noise
Morning and evening demand, traffic, midday stability, and later-trip risk create different offer mixes. A reasonable trip in a slow period may be a poor choice when stronger nearby offers are likely. Use simple time-specific rules rather than reacting emotionally to every card: weight pickup and duration more heavily in congestion, preserve fuel before a high-demand window, and compare the remaining goal with the time left.
The event log explains why a shift moved away from the plan. Read it after each trip for delays, tips, route concerns, fuel warnings, rating changes, and fatigue effects. Do not rewrite the entire strategy after one event. Change a rule only when the summary and the event evidence point to a pattern worth testing.
Use income and trip goals to ask different questions
Income mode is best for studying net earnings, unit economics, and opportunity cost. Trips mode emphasizes throughput, time, fuel, and fatigue. A trip-count win can still have weak economics, while an income win can still be unsafe if fatigue is ignored. Treat the goal as one constraint inside the investigation, not the only measure of success.
Once the default income goal is repeatable, raise the target or switch modes. Save the personal best as a benchmark, but compare the conditions too. A higher score produced by a favorable dispatch mix does not necessarily show that the decision rule improved.
50-minute classroom investigation
- 8 minutes: define gross fare, fee, variable cost, net contribution, net earnings per hour, opportunity cost, and constraint.
- 7 minutes: pairs choose one measurable trip, fuel, or rest rule and predict its effect on three measures.
- 20 minutes: run a baseline and controlled test, recording offers, choices, events, and results. If random offer mixes differ sharply, label that limitation.
- 10 minutes: calculate the change in net earnings per hour and interpret it with rating, fatigue, fuel, trips, or acceptance rate.
- 5 minutes: write one claim, cite two numbers, name one model limit, and explain why safety overrides the target.
Teachers can connect the investigation to opportunity cost, financial literacy, business ethics, or the risk and resilience guide. Students should use fictional results and should not enter personal locations, income, platform, or work information.
Safety, legal, financial, and model limits
This is a fictional learning model, not driving, legal, employment, tax, insurance, or financial advice. It cannot predict real earnings. It omits or simplifies local fares and demand, taxes, insurance, licensing, inspections, maintenance, depreciation, financing, cleaning, accessibility duties, worker classification, road rules, platform contracts, benefits, disputes, weather, emergencies, and many other costs and obligations.
In real driving, obey current traffic, licensing, insurance, platform, accessibility, tax, employment, and working-time requirements for the actual location and situation. Never interact with a device while driving. Stop and rest whenever needed. Personal safety and the safety of riders and road users override every fare, incentive, rating, streak, trip count, and income goal.
Frequently asked questions
What is a good starting strategy in the Ride-Hailing Driver Simulator?
Start with the default income goal, accept trips with reasonable pickup distance and positive estimated net value, protect a fuel reserve, and rest before fatigue becomes a safety constraint. Record a baseline before changing one trip rule.
Should I accept every high-fare ride?
No. Compare estimated net value with pickup distance, time, fuel, fatigue, rating risk, and the next-best use of the shift. A large gross fare can still produce weak net earnings per hour.
When should I refuel or rest?
Refuel before low fuel removes safe choices, ideally during a weaker demand period. Rest before fatigue becomes high; safety and legal driving limits always override an income or trip target.
Which result matters most?
Net earnings per hour is a useful summary, but interpret it with completed trips, fuel, distance, rating, fatigue, acceptance rate, and whether the selected goal was reached safely.
Does the simulator predict real driving income?
No. It omits changing local fares, taxes, insurance, maintenance, depreciation, licensing, accessibility duties, worker classification, road conditions, platform rules, and other important factors.
Continue the learning path
Play the Ride-Hailing Driver Simulator · Print the worksheet · Check the math · Compare a route-based service business · Browse all strategy guides · See all learning resources