Restaurant simulator model guide
Fast-Casual Restaurant Simulator Strategy Guide
The safest Fast-Casual strategy is to prove that a focused menu and the starting team can serve profitable demand before adding discounts, advertising, or payroll. Preserve one full-month baseline, change one lever, and compare completed orders, lost customers, kitchen pressure, contribution, monthly profit, satisfaction, and cash.
Jump directly into a structured baseline challenge
Launch Restaurant Profit Simulator with counter service flow, rapid ticket turnaround, and lunch peak volume.
Understand the Fast-Casual operating model
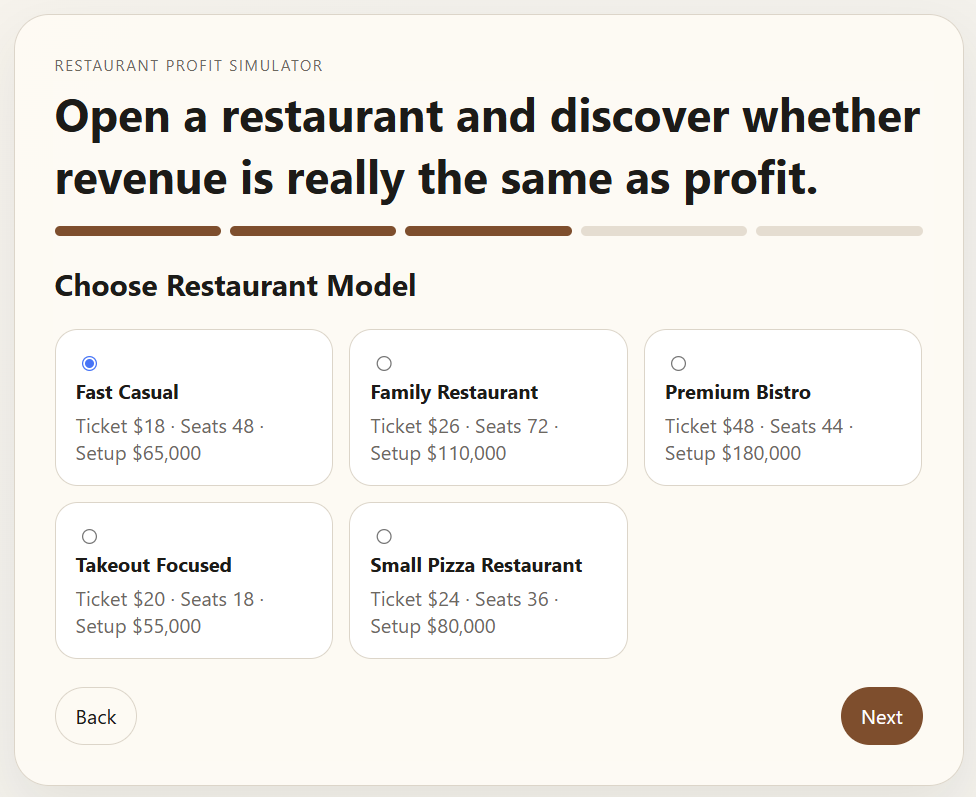
Fast Casual is the simulator’s balanced, speed-oriented restaurant model. Its starting assumptions include a $65,000 setup cost, an $18 base ticket, 48 seats, three chefs, four servers, one cleaner, one manager, a 29% base food-cost rate, a 2.7 table-turnover factor, and a 24% delivery tendency. Those are fictional model inputs, not estimates for a real restaurant.
| Starting feature | What it makes possible | What can go wrong | Measure to watch |
|---|---|---|---|
| $18 base ticket | Accessible demand and repeatable orders | Discounts or higher costs can thin contribution quickly | Contribution per completed order |
| 48 seats and 2.7 turnover | Useful dine-in throughput | Traffic may still outrun kitchen or service capacity | Seat utilization, pressure, lost customers |
| Lean starting team | Payroll can remain controlled | Unfocused menus or demand spikes can create overload | Service capacity, morale, turnover risk |
| 24% delivery tendency | Orders are not limited to seats | Platform fees and kitchen competition can weaken profit | Delivery share, platform-cost share, profit |
| 29% base food cost | Room for positive unit contribution | Ingredient upgrades and waste may consume the margin | Food-cost share, menu quality, satisfaction |
The model rewards fit among demand, menu complexity, staffing, and value. A busy restaurant can still lose money; a high-margin restaurant can still stall if it turns customers away. Read customer, operating, people, and financial measures together.
Build a clean one-month baseline
- Choose one context. A moderate-cost city and a shopping, office, residential, university, or tourist location each create different rent and demand patterns. Record the exact choice.
- Keep the default operating policy. Use Balanced pricing, Standard Ingredients, no promotion, Local Flyers, the default advertising budget, and the starting staff.
- Keep the menu focused. Avoid adding several dishes before the first report. Extra complexity can change required chef capacity and blur the reason results moved.
- Run the complete month. Daily randomness makes one day weak evidence. Save the monthly revenue, food cost, payroll, rent, marketing, platform fees, profit, cash, order mix, satisfaction, reputation, and staff count.
- Choose one bottleneck. State whether the evidence points first to weak demand, thin contribution, dine-in capacity, kitchen pressure, service quality, delivery cost, or fixed overhead.
A baseline is not a strategy recommendation. It is the comparison point that makes the next test interpretable.
Calculate the economics behind the dashboard
Completed orders
Dine-in orders + delivery orders. Use the same period for every comparison.
Contribution per order
(Revenue − food cost − delivery platform fees) ÷ completed orders. This is not net profit because payroll, rent, marketing, and other costs remain.
Approximate break-even orders
(Payroll + rent + marketing + other fixed period costs) ÷ contribution per order. Round up and label the period.
Net profit margin
Monthly net profit ÷ monthly revenue × 100. A higher ticket helps only if the resulting demand and costs still support profit.
For example, if a fictional month shows $54,000 revenue, $15,660 food cost, $3,240 platform fees, and 2,700 completed orders, contribution per order is ($54,000 − $15,660 − $3,240) ÷ 2,700 = $13. If payroll, rent, marketing, and other fixed costs total $28,600, approximate break-even volume is 2,200 completed orders. This example explains the method; it is not a target or forecast.
Run a baseline, test, and repeat experiment
Choose one question before looking at the next result. Keep city, location, model, challenge, menu, time horizon, and every unrelated setting constant. Repeat the changed run because random events and daily variation can make a single comparison misleading.
| One-change test | Prediction | Primary outcome | Guardrails | Stop or revise when |
|---|---|---|---|---|
| Balanced to Premium Pricing | Contribution may rise while orders decline | Monthly profit and margin | Completed orders, satisfaction, reputation | Profit falls or value measures weaken repeatedly |
| No promotion to Lunch Combo | Targeted volume may use spare capacity | Incremental contribution | Kitchen pressure, lost customers, quality | Discounted demand overloads service or lowers profit |
| Add one chef | Kitchen capacity may recover lost orders | Lost customers and profit | Payroll share, pressure, morale | Payroll rises without a repeated capacity improvement |
| Increase advertising budget | Reach may create more demand | Added contribution minus added marketing cost | Capacity, satisfaction, cash | Demand is unprofitable or the operation is already constrained |
| Standard to Premium Ingredients | Quality may support satisfaction and pricing | Profit with satisfaction | Food-cost share, cash, completed orders | Higher cost is not recovered through durable value |
Decision rule: keep a change only when it improves the preselected outcome across the matched run and repeat without breaching a customer, worker, cash, quality, or compliance guardrail.
Diagnose common Fast-Casual result patterns
| Pattern | Likely interpretation | Safer next test |
|---|---|---|
| Revenue rises, profit falls | Discount, food, payroll, marketing, or platform cost grew faster than contribution | Remove the most recent cost or promotion and repeat the month |
| Lost customers and kitchen pressure are high | Demand may exceed productive capacity; more promotion could worsen the queue | Test one chef or reduce menu complexity before buying demand |
| Seat utilization is low but kitchen pressure is high | Delivery or menu work may be consuming kitchen capacity while seats sit open | Compare delivery share and simplify one high-complexity item |
| Contribution is healthy but order count falls | Price or value may be limiting conversion | Return to Balanced pricing or improve quality in a separate test |
| Satisfaction and morale decline together | Workload, shortages, or management coverage may be affecting both service and staff | Stabilize capacity and staffing before promotion or price experiments |
| Profit rises once but not on repeat | Random demand or an event may explain the apparent win | Run another matched month and use a range, not one point result |
Do not automatically hire because pressure is high. First confirm that the signal repeats and that the added completed-order contribution can cover payroll. Do not automatically advertise because capacity is idle. First confirm that contribution per order is positive and the offer is credible.
Use the guide for a 50-minute classroom investigation
- 5 minutes: identify the Fast-Casual value promise and predict its main bottleneck.
- 10 minutes: run or inspect the baseline and calculate completed orders and contribution per order.
- 5 minutes: choose one price, promotion, ingredient, staffing, menu, or advertising change and precommit the outcome and guardrails.
- 15 minutes: run the matched test and repeat, recording the same monthly measures.
- 10 minutes: calculate profit margin or approximate break-even orders and diagnose the causal chain.
- 5 minutes: recommend adopt, revise, retest, or stop, supported by two measures, one tradeoff, and one model limitation.
Teacher prompt: “Did the decision improve the restaurant system, or did it move cost, delay, workload, or risk somewhere less visible?” For a 20-minute route, provide a baseline and one test result. For a no-device route, print two monthly reports and use the same calculations and recommendation frame.
Keep restaurant decisions responsible
This simulator is a simplified educational model. It does not reproduce local food-safety rules, allergen controls, permits, accessibility duties, employment standards, taxes, leases, insurance, waste handling, delivery contracts, or every operating cost. A high simulated score is not evidence that a real restaurant will be safe, lawful, viable, or profitable.
- Never reduce staffing, cleaning, ingredient handling, rest, training, or maintenance below applicable safety and employment requirements.
- Use truthful, supportable marketing. Do not invent reviews, hide material offer terms, target vulnerable people unfairly, send unsolicited bulk messages, or generate invalid advertising traffic.
- Do not collect personal information for the classroom activity. Use fictional restaurant names, customers, and results.
- Before a real decision, verify current primary sources and local requirements, complete full financial and risk analysis, and obtain qualified advice where needed.
The appropriate classroom conclusion is a bounded hypothesis: what worked inside the model, under which conditions, what worsened, what remains unknown, and what evidence would be needed next.
Fast-Casual Restaurant Simulator FAQ
What is a good beginner setup for the Fast-Casual model?
Use a moderate-cost city and location, Balanced pricing, Standard Ingredients, no promotion, Local Flyers, the default advertising budget, and the starting staff. Run a complete month before changing one decision.
Should I hire more staff or attract more customers first?
Read demand and capacity together. Hire only when lost customers, service capacity, or kitchen pressure show a repeated bottleneck and contribution is healthy. Attract demand only when spare capacity and positive unit economics are visible.
When should I test a lunch combo?
Test it after a stable baseline shows spare capacity during the targeted period. Keep it only if incremental contribution covers the discount and added workload without damaging quality or satisfaction.
How can Fast-Casual revenue rise while profit falls?
Discounts, ingredient upgrades, payroll, advertising, rent, delivery platform fees, or events can absorb the extra revenue. Compare cost shares and contribution per completed order instead of treating revenue as profit.
Can this Fast-Casual guide be used in class?
Yes. Students can run a baseline and one matched change, calculate contribution, break-even orders, and margin, explain one tradeoff, identify a model limitation, and recommend a next test in about 50 minutes.