Restaurant simulator model guide
Premium Bistro Simulator Strategy Guide
The safest Premium Bistro strategy is to prove that the experience supports its high cost before adding demand. Start with one neutral month, protect cash, then test price, ingredient quality, menu complexity, or capacity one lever at a time. Judge the change with completed orders, contribution, profit, cash, satisfaction, and reputation—not revenue alone.
Jump directly into a structured baseline challenge
Launch Restaurant Profit Simulator with 45 fine-dining tables, premium wine/entree tickets, and culinary staff.
Understand the Premium Bistro starting model
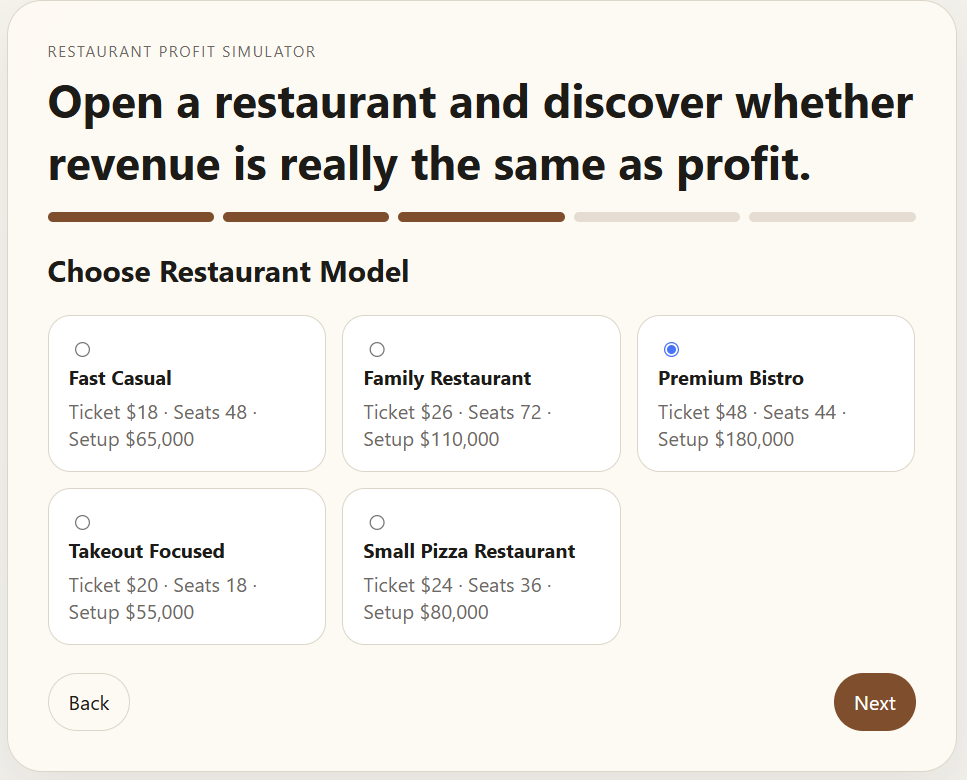
Premium Bistro begins with a modeled $180,000 setup cost, $48 base ticket, 44 seats, 1.75 table turns, a 38% base food-cost rate, and an 8% delivery tendency. Its role requirements begin at five chefs, six servers, two cleaners, and one manager. Because the restaurant is modeled as open seven days while staff work five, the simulator automatically adds coverage; the opening roster is larger than those role requirements.
| Starting feature | Premium Bistro assumption | Decision implication |
|---|---|---|
| Setup and cash | $180,000 setup; $0 standard starting cash after setup | The first month must protect liquidity. A profitable-looking asset value cannot pay payroll or rent. |
| Ticket and food | $48 base ticket; 38% base food cost | Base food cost is about $18.24 per order before city, price, ingredient, promotion, and event effects. |
| Dining room | 44 seats; 1.75 base turnover | The model has less seating and slower turnover than the higher-volume formats, so value per completed visit matters. |
| Labor | 5 chefs, 6 servers, 2 cleaners, 1 manager before coverage | Complex menus or weak demand can create expensive underused capacity; overload can damage a high-expectation experience. |
| Channel mix | 8% model delivery tendency | Dine-in experience is central. Delivery can add reach, but a 25% platform fee can weaken contribution. |
City and location multiply these assumptions. Downtown Metro and High Cost City lift spending power but also raise rent and wages. Tourist Spot lifts traffic and weekend demand but has a 1.25 rent multiplier. A reasonable comparison keeps city and location fixed; otherwise a concept decision becomes tangled with market and rent changes.
Build a clean one-month baseline
- Choose Standard challenge and record the city, location, model, term, and goal.
- Keep Balanced pricing, Standard Ingredients, no promotion, Local Flyers, the starting $1,200 monthly ad budget, and starting staff.
- Do not add or remove dishes during the baseline. Record the opening ticket, food-cost setting, menu complexity, staff, rent, and cash.
- Run the full month. Record completed dine-in and delivery orders, lost customers, seat utilization, kitchen pressure, satisfaction, reputation, revenue, food cost, platform fees, payroll, marketing, rent, profit, and ending cash.
- Repeat the baseline when a temporary event materially changes demand or cost. A matched comparison needs similar conditions.
Precommit the decision rule before the test. For example: “Keep Premium Pricing only if monthly profit improves, cash is not lower, satisfaction remains at least 65, and reputation does not fall by more than two points.” A rule prevents a large revenue number from hiding a worse business.
Calculate Premium Bistro economics
Base dine-in contribution
$48 ticket − ($48 × 38% food cost) = $29.76 before payroll, rent, marketing, maintenance, events, and taxes not modeled.
Base delivery contribution
$48 − $18.24 food cost − $12 platform fee = $17.76 before other costs. The simulator's default platform rate is 25%.
Contribution per completed order
(Revenue − food cost − delivery platform fees) ÷ completed orders. Use report totals when mix, pricing, or promotions change.
Approximate break-even orders
(Payroll + rent + marketing + other fixed period costs) ÷ contribution per order. Keep every amount in the same period and round orders up.
Net profit margin
Monthly profit ÷ monthly revenue × 100. Compare margin with cash because setup and timing can make liquidity the binding constraint.
Incremental profit
Test-month profit − baseline-month profit. A campaign, staff addition, or quality upgrade is justified only by the whole change, not its sales alone.
Premium Pricing multiplies the ticket by 1.18 and modeled conversion by 0.84. Premium Ingredients multiply food cost by 1.22 and add 0.09 to the satisfaction effect. These levers may complement each other, but testing both at once does not reveal which one caused the result.
Run four controlled Premium Bistro experiments
1. Test price after trust
Compare Balanced with Premium Pricing only after satisfaction, reputation, service, and cash are stable. Hold ingredients, menu, staff, promotion, campaign, and advertising fixed. A successful test can lose some orders while raising contribution and profit. Reverse the change when conversion and profit fall together or when satisfaction weakens because value no longer meets expectations.
2. Test ingredient quality as an investment
Compare Standard with Premium Ingredients while holding the price constant. Record food-cost share, satisfaction, reputation, completed demand, profit, and cash. Premium ingredients are not automatically “correct” for a premium concept: the modeled 22% food-cost increase must create enough trust, demand, or later pricing power to repay itself.
3. Simplify menu complexity before hiring
A complex menu can raise required chef coverage and kitchen pressure. Remove one weak or complex dish in the test while leaving staffing and demand settings unchanged. Keep the simpler menu if completed orders, service quality, and profit improve without damaging ticket or satisfaction. This tests process design before adding recurring payroll.
4. Match capacity to a measured bottleneck
When lost customers, kitchen pressure, or service quality indicate a persistent constraint, add one relevant role and repeat the month. Compare incremental contribution with added payroll, then inspect satisfaction and cash. Do not add demand through Influencer Review or a larger advertising budget until the operation can complete that demand reliably.
Diagnose six common result patterns
| Observed result | Likely explanation | Next matched test |
|---|---|---|
| Revenue rises; profit and cash fall | Food, labor, rent, advertising, event, or delivery costs grew faster than contribution. | Hold demand fixed and reverse the largest discretionary cost change. |
| High satisfaction; spare capacity | The experience works, but traffic or conversion is weak. | Test one price or reach lever, not a staff addition. |
| Lost customers and high kitchen pressure | Menu complexity or chef capacity limits completed demand. | Simplify one dish set or add one chef-coverage unit, separately. |
| High utilization; satisfaction declines | Service, kitchen, cleaning, or quality is failing under load. | Stabilize the measured constraint before promoting or raising price. |
| Premium Ingredients lift satisfaction but cut profit | The trust benefit has not yet repaid the higher food cost. | Repeat to check the reputation effect, then test pricing separately. |
| Strong net worth; negative cash | Modeled asset value masks a liquidity shortage after the $180,000 setup. | Reduce discretionary spending and protect positive-contribution orders. |
Temporary events can imitate a strategy effect. A blogger review, equipment failure, supplier increase, inspection warning, festival, weather event, or competitor can shift demand, reputation, or cost. Label the event and repeat the test rather than presenting one noisy month as proof.
Teach a 50-minute premium-positioning investigation
- Frame the question — 5 minutes. Ask: should the bistro first protect quality, raise price, simplify the menu, or add capacity?
- Map the model — 7 minutes. Students connect ticket, conversion, food cost, capacity, completed orders, contribution, profit, cash, satisfaction, and reputation.
- Run a baseline — 10 minutes. Teams use the neutral settings and record a complete month in the worksheet.
- Change one lever — 10 minutes. Each team tests pricing, ingredient quality, one menu change, or one staffing change.
- Calculate and diagnose — 10 minutes. Calculate contribution per order, net profit margin, and incremental profit; identify the constraint.
- Recommend and challenge — 8 minutes. Give a claim, two comparable measures, one tradeoff, one model limitation, and the next decision rule.
For a 25-minute route, provide baseline and test reports and skip gameplay. For a no-device route, print the model table and two fictional reports. Assign owner, customer, worker, and regulator perspectives so students distinguish financial performance from a complete responsible decision.
Keep the decision legal, safe, and model-bounded
Restaurant Profit Simulator is an educational model, not a forecast, business plan, valuation, or professional recommendation. It simplifies taxes, financing, leases, permits, inspections, food safety, allergen controls, liquor licensing, employment and scheduling law, wages, tips, accessibility, insurance, supplier contracts, equipment, waste, delivery-platform terms, privacy, and local competition. Real operators need current local evidence and qualified advice.
Do not interpret cheaper labor, more expensive menu items, or stronger sales as automatically responsible. A real premium claim must be truthful and supportable. Offers must not hide conditions, ingredient or sustainability claims need evidence, customer data should be minimized, and advertising must not target or mislead people unlawfully. Ads and promotions should remain clearly separate from navigation, ordering controls, and essential information.
Premium Bistro Simulator FAQ
What is a good beginner setup for the Premium Bistro model?
Use Standard challenge, a city and location with enough spending power but manageable rent, Balanced pricing, Standard Ingredients, no promotion, Local Flyers, the starting advertising budget, and starting staff. Run a complete month before changing one decision.
Should Premium Bistro use Premium Pricing immediately?
Not automatically. First establish stable satisfaction, reputation, service, and positive contribution. Then compare Premium Pricing with a matched Balanced run because the higher ticket also reduces modeled conversion.
Are Premium Ingredients always best for Premium Bistro?
No. Premium Ingredients raise modeled food cost by 22% and satisfaction potential by 9 percentage points. Keep them only when stronger trust, demand, pricing power, or profit outweighs the added cost.
Why can Premium Bistro revenue rise while cash and profit fall?
Food cost, payroll, rent, advertising, event costs, and delivery fees may grow faster than contribution. The model also uses the full standard starting cash allowance for setup, so an unprofitable opening month creates immediate cash pressure.
Can this Premium Bistro guide be used in class?
Yes. Students can run a baseline and one matched change, calculate contribution and profit margin, diagnose the main constraint, explain a tradeoff and model limitation, and propose the next test in about 50 minutes.