Restaurant Simulator Decision Guide
Restaurant Simulator Strategy: Test Price, Staffing, Quality and Profit
A strong restaurant simulation strategy is not a secret sequence of clicks. It is a repeatable decision process: establish a baseline, find the limiting part of the business, change one major lever, and check whether the benefit is greater than the financial and customer cost.
Jump directly into a structured baseline challenge
Launch Restaurant Profit Simulator with balanced table capacity, ingredient purchasing, and menu margins.
The short answer: improve the current constraint
Start with balanced settings and let the restaurant produce a baseline. If customers are being lost and wait or kitchen pressure is high, test capacity before spending on more demand. If capacity is comfortable but demand is weak, test price, positioning, promotion, or delivery. If sales are healthy but profit is weak, inspect food cost, payroll, platform fees, marketing, waste, and fixed costs before chasing still more volume.
Judge a change with a balanced set of measures. Profit and cash show whether the restaurant can sustain the choice. Customer count and lost demand show market response. Wait, quality, satisfaction, and reputation show whether the experience can support future demand. A decision is stronger when it improves the intended outcome without merely moving the problem somewhere else.
Choose a restaurant model that fits the question
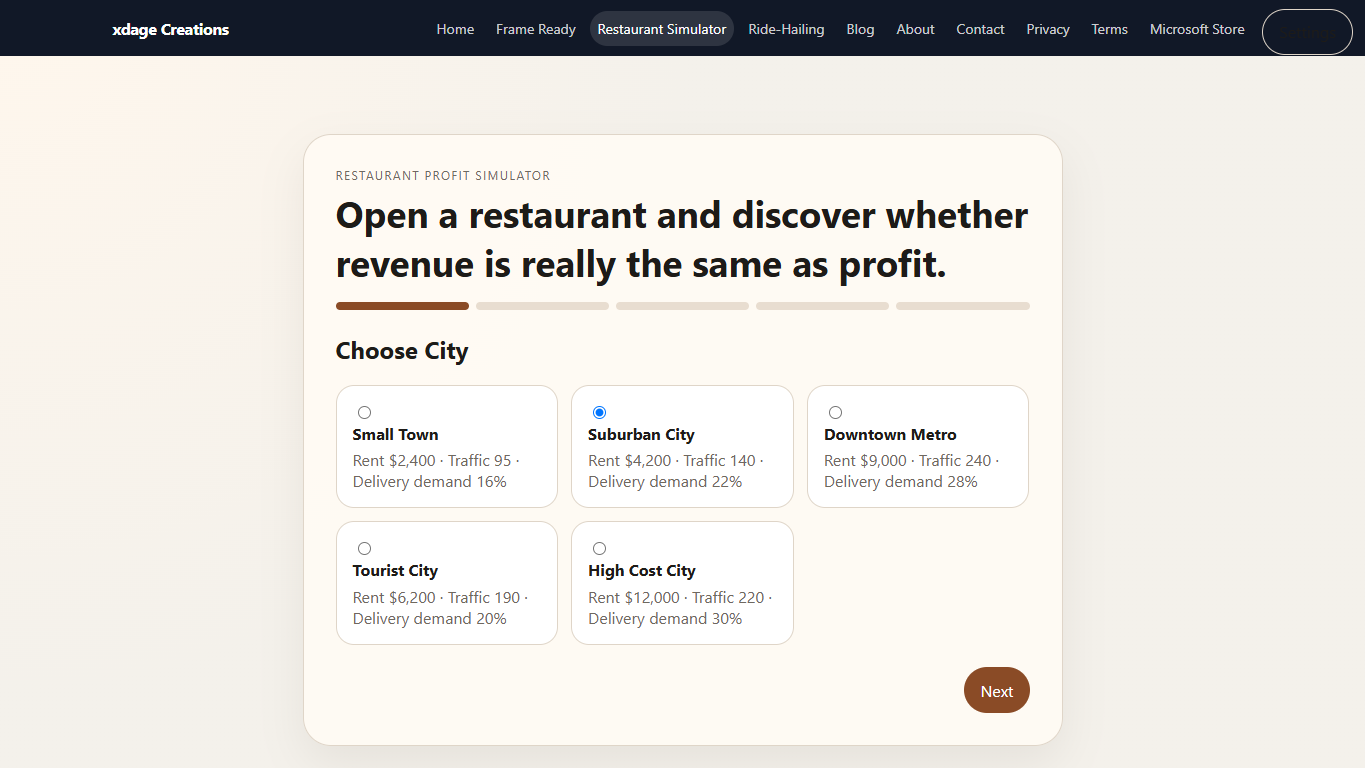
The setup wizard changes the operating problem before the first day begins. For a fair comparison, keep city and location the same while changing only the concept. For an operating experiment, keep all three setup choices the same.
| Concept | Useful question | Pressure to watch | Focused guide |
|---|---|---|---|
| Fast Casual | Can throughput and a clear offer produce reliable contribution? | Queue, labor, menu complexity | Open guide |
| Family Restaurant | Does fuller service and seating create enough value to cover staffing? | Servers, table flow, satisfaction | Open guide |
| Small Pizza Restaurant | Can a compact product and delivery mix remain profitable? | Kitchen capacity, fees, menu focus | Open guide |
| Premium Bistro | Will quality and experience support the required ticket price? | Food cost, expectations, fixed cost | Open guide |
| Takeout Focused | Does added order volume cover platform fees and kitchen pressure? | Delivery mix, speed, margin | Open guide |
Use contribution and profit math before adding volume
Contribution per order is approximately the selling price minus food cost, packaging, delivery fees, and other costs that rise with that order. It is the amount left to cover payroll, rent, marketing, maintenance, and profit. More orders help only when their combined contribution is positive and the restaurant can serve them without damaging the experience.
Incremental result asks whether a change paid for itself:
Incremental result = contribution from added orders − added payroll − added marketing − other added operating costs
Suppose a staffing test creates 18 additional orders at an estimated $7 contribution each. That is $126 of added contribution. If the added payroll is $90 and other added costs are $12, the incremental result is $24. The staffing change may be promising, but it still needs a repeat and a check of waits, quality, satisfaction, and cash.
Profit margin = profit ÷ revenue × 100. Margin makes two different-sized runs easier to compare. A run with higher revenue but a lower margin may be using resources less effectively. Use the worked calculations and answer key when you need a step-by-step profit, margin, break-even, or percent-change check.
Run one controlled restaurant experiment
1. State the question
Write a testable question such as, “Will one added kitchen employee reduce lost orders enough to improve daily profit?” Avoid a vague goal like “make the restaurant better.”
2. Record the baseline
Save the city, location, concept, day range, price, quality, menu, staffing, promotion, delivery, and key dashboard results. The baseline is the comparison, not a warm-up to ignore.
3. Predict connected effects
Predict a direct outcome, a financial result, and a guardrail. More kitchen labor might reduce lost demand, raise sales, and increase payroll while protecting quality.
4. Change one major lever
Keep the setup and other operating choices stable. If price, staffing, quality, promotion, and menu all change together, the result cannot show which decision caused the difference.
5. Compare matching periods
Compare the same number of days and include demand, capacity, experience, cost, cash, and profit measures. Do not compare a rent day with an ordinary day as though timing were equal.
6. Repeat before scaling
Random events and demand variation can make one result misleading. Repeat the promising setting, then keep, revise, or reverse it with a written reason and a next test.
For a reusable fair-test format, use the business simulation controlled experiment guide.
Diagnose the dashboard before making the next move
| Observed pattern | Likely issue | Useful next test |
|---|---|---|
| Lost customers and wait rise together | Service or kitchen capacity may be below demand. | Test the limiting staff role or reduce menu complexity while holding promotion steady. |
| Revenue rises but profit falls | Added sales may carry too much food cost, payroll, discounting, marketing cost, or delivery fees. | Use the profit bridge and test one margin lever with the same demand setting. |
| Profit rises while satisfaction falls | A price, quality, staffing, or service cut may be creating future demand risk. | Repeat longer and try a smaller cost or price change that protects experience. |
| Promotion adds customers but worsens waits | The campaign is feeding a capacity constraint. | Return to the baseline, stabilize capacity, then retest the same promotion. |
| Delivery volume grows but margin stays weak | Platform fees or kitchen congestion may absorb the extra contribution. | Compare delivery exposure while holding price, menu, and staffing constant. |
| One day is sharply worse than the trend | Rent timing, an event, or normal variation may distort the daily result. | Use the monthly report and a matching repeat before changing strategy. |
Match the strategy lever to the evidence
Price and quality
A lower price can improve conversion but reduce contribution per order. A higher price can improve contribution but lose demand when the experience does not support the value promise. Ingredient quality can strengthen satisfaction and pricing power, but its higher food cost must be earned back.
Test price only after checking capacity. If the restaurant already loses customers through long waits, a discount may attract demand the operation cannot serve.
Staffing and menu complexity
More staff are useful when a measured constraint prevents profitable orders or harms quality. Otherwise, added payroll can turn a busy restaurant into a weak one. A larger menu can attract interest, but it can also raise complexity and kitchen pressure.
Test the specific role or remove weak dishes before expanding broadly. Capacity is valuable when it converts constrained demand into enough contribution to cover its cost.
Marketing and promotion
Marketing should have a named audience, offer, time window, expected response, and cost. Measure incremental contribution rather than raw traffic or sales. A promotion that creates heavily discounted, low-margin demand is not automatically successful.
Keep claims truthful and proportionate to evidence. The responsible advertising lesson adds claim, disclosure, targeting, and traffic-quality checks.
Delivery and reports
Delivery can extend reach, but fees and kitchen congestion can weaken the economics. Compare the additional contribution with fees and any service effect. Use monthly reports to separate a pattern from daily noise and fixed-cost timing.
Treat cash as a survival constraint and profit as performance over the period. A promising strategy that exhausts cash before it can work still needs revision.
Use the guide in a 50-minute classroom investigation
- Minutes 0–7: define revenue, contribution, profit, margin, capacity, and guardrail measures.
- Minutes 7–15: teams use the same setup, record a baseline, and identify one constraint.
- Minutes 15–20: each team writes a hypothesis with one decision, a predicted outcome, and a possible tradeoff.
- Minutes 20–32: teams run the matched test and record the same demand, cost, customer, cash, and profit measures.
- Minutes 32–40: students calculate a variance, contribution estimate, or margin and decide whether the evidence supports the claim.
- Minutes 40–50: teams compare results; each learner submits an individual recommendation, limitation, and next test.
Assign different levers—price, staffing, ingredient quality, menu complexity, promotion, or delivery—to create comparable evidence without having every group repeat the same test. If devices are limited, one operator can run the simulation while recorder, checker, constraint monitor, and skeptic roles rotate.
The restaurant student lesson provides a complete evidence table and rubric. Teachers can also use the accounting lesson, marketing lesson, or operations lesson for a course-specific route.
Keep the simulation in its responsible-use boundary
The Restaurant Profit Simulator is a simplified learning model, not a business plan, valuation, market study, or earnings forecast. A real restaurant faces local food-safety rules, allergen controls, permits, inspections, liquor licensing where relevant, employment and scheduling law, accessibility duties, taxes, insurance, leases, financing, supplier contracts, equipment standards, worker safety, waste handling, delivery-platform terms, competition, and changing customer behavior.
Do not use a simulated result alone to make a real investment, employment, pricing, safety, advertising, or legal decision. Use current local evidence and qualified financial, legal, food-safety, tax, licensing, employment, or industry advice where appropriate. Never test a classroom idea through real purchases, reviews, calls, bookings, personal-data collection, covert observation, or misleading promotion.
The game is free and requires no student account. Learners can use fictional team names and report aggregate simulated results without sharing personal information.
Frequently asked questions
What is the best strategy for the Restaurant Profit Simulator?
Begin with a stable baseline, identify the current constraint, and change one major decision at a time. Compare demand, capacity, customer experience, costs, cash, and profit over matching periods before keeping the change.
How do I know whether a restaurant price increase worked?
A price increase worked only if the additional contribution per order outweighed any lost demand and did not create an unacceptable decline in satisfaction, reputation, cash, or longer-term performance.
When should I hire more restaurant staff in the simulator?
Test more staff when lost customers, wait time, kitchen pressure, or service problems show a capacity constraint. Then confirm that added contribution is greater than added payroll while quality and customer measures improve or remain healthy.
Why can restaurant revenue rise while profit falls?
The added sales may carry high food cost, delivery fees, promotion cost, waste, or payroll, or the restaurant may have discounted too heavily. Use the profit bridge to compare the revenue gain with every added cost.
Can this simulator predict whether a real restaurant will succeed?
No. The simulator is a simplified educational model, not a forecast or professional business, legal, food-safety, employment, tax, or licensing advice. Real decisions require local evidence and qualified guidance.