Restaurant simulator model guide
Takeout Restaurant Simulator Strategy Guide
The safest Takeout Focused strategy is to prove contribution and kitchen capacity before buying more delivery demand. Preserve a full-month baseline, change one lever, and compare delivery mix, completed orders, platform fees, kitchen pressure, monthly profit, satisfaction, and cash.
Jump directly into a structured baseline challenge
Launch Restaurant Profit Simulator with digital order queues, packaging inventory, and courier driver flow.
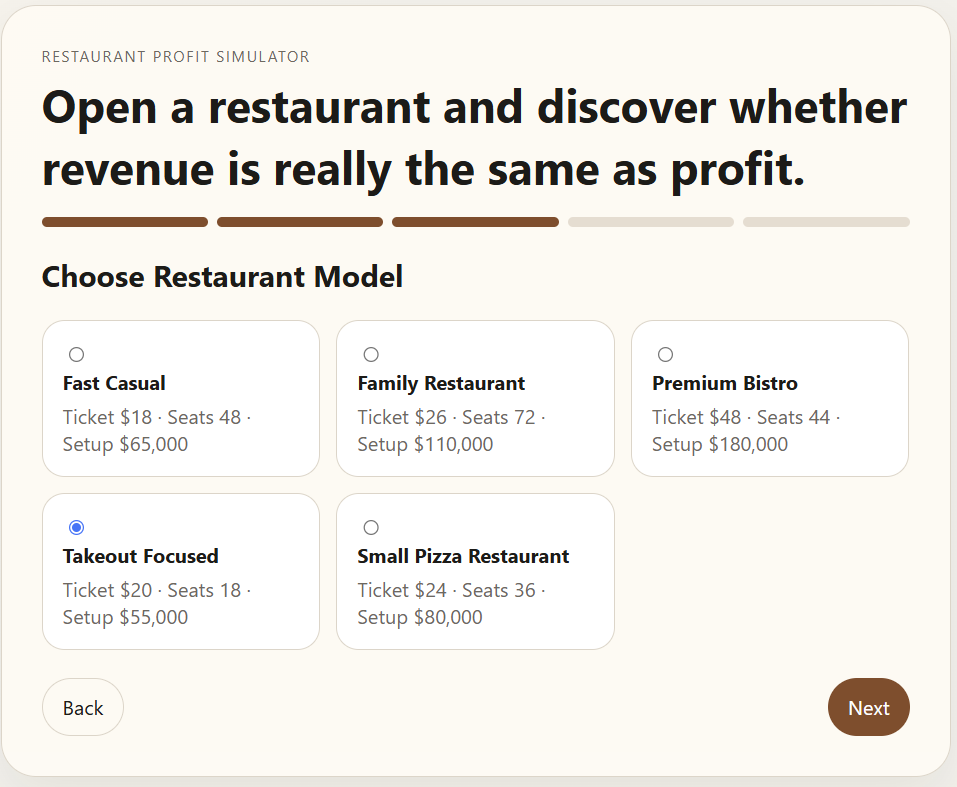
Understand the Takeout Focused model
The simulator starts this fictional model with a $55,000 setup cost, $20 base ticket, 18 seats, four chefs, two servers, one cleaner, one manager, a 31% base food-cost rate, a 2.0 table-turnover factor, and a 52% delivery tendency. It also charges a 25% platform fee on delivery revenue. These are learning-model inputs, not real restaurant estimates.
| Starting feature | Opportunity | Main risk | Measure to watch |
|---|---|---|---|
| $20 base ticket | Useful revenue per completed order | Discounts and fees can thin contribution | Contribution per order |
| 52% delivery tendency | Demand is not limited to 18 seats | Platform fees absorb part of each delivery sale | Delivery mix and platform-cost share |
| Four-chef starting team | Kitchen-first capacity supports packaged orders | Promotion can still overload production | Kitchen pressure and lost customers |
| Two servers and 18 seats | Lower front-of-house burden | Dine-in and pickup service can still become constrained | Service capacity and satisfaction |
| 31% base food cost | Positive unit contribution is possible | Premium inputs, promotions, and events may consume it | Food-cost share and profit margin |
The model does not win simply by maximizing delivery orders. It wins when completed orders produce enough contribution to cover payroll, rent, marketing, maintenance, and other costs while preserving service quality and cash.
Build a clean one-month baseline
- Record the context. City and location change rent, wages, traffic, spending, meal periods, and delivery tendency. Residential Street and University Area favor delivery in the model, but a higher delivery mix is not automatically more profitable.
- Start with neutral controls. Use Balanced pricing, Standard Ingredients, no promotion, Local Flyers, the default advertising budget, and starting staff.
- Keep the menu focused. Start with a small set of portable dishes. Menu changes can alter complexity and blur whether price, capacity, or product fit caused the result.
- Complete the full month. Save revenue, food cost, payroll, rent, platform fees, marketing, profit, cash, dine-in and delivery orders, lost customers, pressure, satisfaction, reputation, and morale.
- Name the constraint. Decide whether the first evidence points to weak demand, poor unit contribution, kitchen pressure, service capacity, customer value, labor cost, or fixed overhead.
A baseline is a reference point, not proof that the initial setup is best. Make the next run interpretable by changing exactly one decision.
Calculate dine-in and delivery contribution
At the $20 base ticket and 31% base food-cost rate, simplified food cost is $6.20 per order. A dine-in order therefore contributes about $13.80 before payroll, rent, marketing, maintenance, and other costs. A delivery order also carries the simulator’s 25% platform fee, or $5.00 at the base ticket, leaving about $8.80 before those remaining costs.
Dine-in contribution
Dine-in revenue − associated food cost. With the base assumptions: $20 − $6.20 = $13.80.
Delivery contribution
Delivery revenue − food cost − platform fee. With the base assumptions: $20 − $6.20 − $5.00 = $8.80.
Blended contribution
(Dine-in contribution + delivery contribution) ÷ all completed orders. Calculate from report totals when price, promotions, or mix change.
Approximate break-even orders
(Payroll + rent + marketing + other fixed period costs) ÷ blended contribution per order. Round up and keep periods consistent.
If 48 of 100 equal-ticket orders are dine-in and 52 are delivery, the simplified total contribution is (48 × $13.80) + (52 × $8.80) = $1,120, or $11.20 per order. This explains why a delivery promotion must add enough profitable completions to offset both its ticket effect and the platform fee. It is a model illustration, not a real-world forecast.
Run a matched delivery experiment
Keep city, location, model, challenge, menu, staffing, ingredient quality, price, advertising, and time horizon constant. Run a baseline with no promotion, change only the promotion to Delivery Free Fee Campaign, then repeat the changed run. Precommit to monthly profit as the primary outcome and kitchen pressure, lost customers, satisfaction, and cash as guardrails.
| Test | Prediction | Primary outcome | Guardrails | Stop or revise when |
|---|---|---|---|---|
| No promotion → Delivery Free Fee Campaign | Delivery share rises, but ticket and channel contribution may fall | Monthly profit | Pressure, lost customers, satisfaction, cash | Added volume does not cover lower ticket and fees |
| Balanced → Premium Pricing | Contribution may rise while demand declines | Profit margin | Completed orders, satisfaction, reputation | Profit or value measures fall repeatedly |
| Add one chef | More kitchen capacity may recover lost orders | Incremental contribution minus payroll | Pressure, morale, cash | Payroll rises without repeated throughput gains |
| Standard → Premium Ingredients | Quality may support satisfaction and price | Profit with satisfaction | Food-cost share, orders, cash | The cost increase is not recovered |
| Increase advertising | Reach may add demand | Added contribution minus marketing cost | Capacity, service, cash | The operation is constrained or unit economics are weak |
Decision rule: adopt a change only when the test and repeat improve the chosen outcome without breaching a customer, worker, quality, cash, or compliance guardrail. Label random events; do not call a one-run difference causal evidence.
Diagnose six common result patterns
| Evidence pattern | Likely interpretation | Safer next test |
|---|---|---|
| Delivery orders rise, profit falls | Lower ticket, platform fees, food cost, or campaign cost absorbed the volume gain | Return to no promotion and compare contribution by channel |
| Kitchen pressure and lost customers are high | Demand is outrunning production capacity | Test one chef or simplify the menu before promoting |
| Seats are underused while the kitchen is overloaded | Delivery work competes for the same kitchen capacity | Hold demand constant and test menu complexity or staffing |
| Revenue rises, cash falls | Payroll, advertising, rent, events, or timing may exceed operating contribution | Use the monthly cost shares and remove one discretionary cost |
| Profit rises while satisfaction falls | The policy may be shifting costs into later reputation or demand | Repeat longer with satisfaction and reputation as stop rules |
| A result improves once but not on repeat | A random event or ordinary variation may explain the apparent win | Run another matched month and report a range |
High order count is not a hiring signal by itself. Require repeated pressure or lost-customer evidence and enough incremental contribution to cover payroll. Spare capacity is not an advertising signal by itself; require positive unit economics and a credible offer first.
Use the guide for a 50-minute classroom investigation
- 5 minutes: identify the model’s takeout value promise and predict its binding constraint.
- 10 minutes: run or inspect the baseline; calculate dine-in, delivery, and blended contribution.
- 5 minutes: choose one decision and precommit the primary outcome, three guardrails, and stop rule.
- 15 minutes: run the matched test and repeat; record the same monthly measures.
- 10 minutes: calculate profit margin or break-even volume and diagnose the operating chain.
- 5 minutes: recommend adopt, revise, retest, or stop using two measures, one tradeoff, and one limitation.
Teacher prompt: “Did the campaign create profitable completed orders, or only more activity?” For a 20-minute route, provide baseline and test reports. For a no-device route, give students 100 equal-ticket orders split 48 dine-in and 52 delivery, then ask them to calculate channel and blended contribution before evaluating a proposed promotion.
Keep restaurant decisions responsible
This simplified simulator does not reproduce local food-safety and allergen controls, permits, accessibility duties, employment standards, taxes, leases, insurance, waste handling, delivery contracts, data protection, or every operating cost. A high score does not show that a real restaurant would be safe, lawful, viable, or profitable.
- Never reduce staffing, cleaning, food handling, rest, training, or maintenance below applicable safety and employment requirements.
- Use truthful, supportable marketing. Do not fabricate reviews, hide material offer terms, send unsolicited bulk messages, manipulate clicks, or create invalid advertising traffic.
- Use fictional names and results in class; do not collect student or customer personal information for the activity.
- For real decisions, verify current primary sources and local rules, complete a full financial and risk analysis, and obtain qualified advice where needed.
Takeout Restaurant Simulator FAQ
What is a good beginner setup for Takeout Focused?
Use one moderate-cost city and delivery-friendly location, Balanced pricing, Standard Ingredients, no promotion, Local Flyers, the default advertising budget, and starting staff. Complete a full-month baseline before changing one decision.
How do I calculate contribution on a delivery order?
Subtract food cost and the platform fee from delivery revenue. At the $20 base ticket, 31% food cost, and 25% platform fee, simplified delivery contribution before payroll, rent, marketing, and other costs is $8.80.
Should I promote delivery or add kitchen capacity first?
Promote only when contribution is positive and the kitchen has spare capacity. If pressure and lost customers are already high, test one capacity change or menu simplification before adding demand.
Why can takeout revenue rise while profit falls?
Discounts, platform fees, food cost, payroll, marketing, events, or rework can grow faster than revenue. Compare contribution per order and monthly cost shares instead of treating order volume as profit.
Can this takeout restaurant guide be used in class?
Yes. In about 50 minutes, students can run a baseline and matched test, calculate dine-in and delivery contribution, diagnose one tradeoff, identify a model limitation, and recommend a next experiment.